Temperature in Nassawadox

Temperature in Nassawadox |
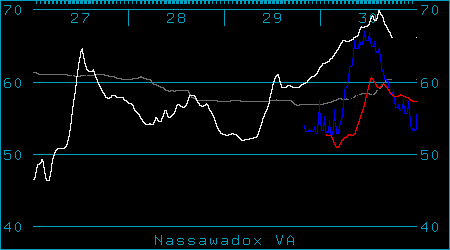
 The above graph shows the temperature as measured at our offices in Nassawadox. The white line shows the actual temperature over the last three to four days. The red line shows the average temperature for the past week. The blue line shows the average temperature for this week each year since 1998. The grey line is the water temperature of the Chesapeake Bay.
Return to weather page |
 >>> Advertise Here <<<
|